In Ternair Campaign, you link all your landing pages, downloads and manual lead entry into one central lead registration.
Get detailed insight into your leads and easily manage different lead types and groups.
In the general settings for Leads, you can view, create, edit and delete Group definitions, Lead type definitions and Feature definitions.
- Group definitions can be used to categorise leads. For example: Website downloads, Events, leads via social media.
- In Leadtype definitions, you specify the types of leads. For example: Whitepapers, Webinars or Customer cases.
- Property definitions can be used to create additional fields with information you want to store about your leads. For example: Event.
Group definition
A group definition can be used to categorise leads. For example: Website downloads, Events, leads via social media.
You can create a new group definition via the ‘Add’ button.
Group definitions previously added are visible on this tab. By clicking on the gear icon, you can edit, duplicate or delete an existing group definition.
The screen with an open edit menu looks like this:
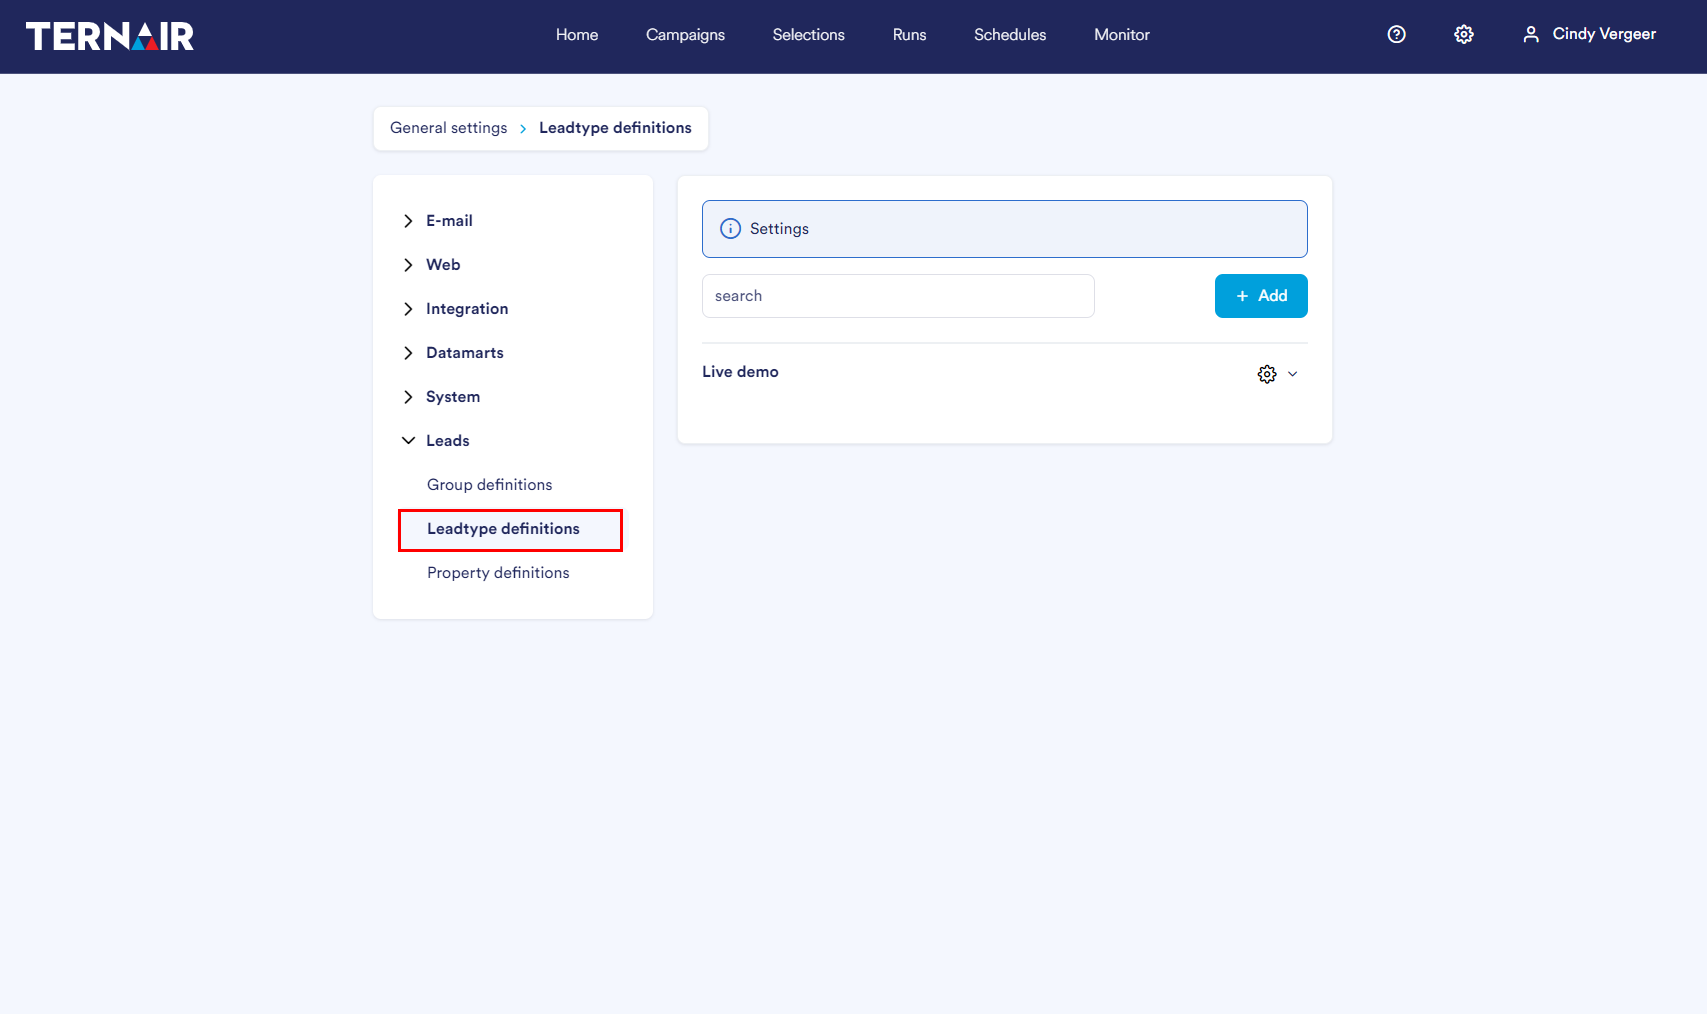
New group definition
Once you have clicked Add, you will see the screen below:
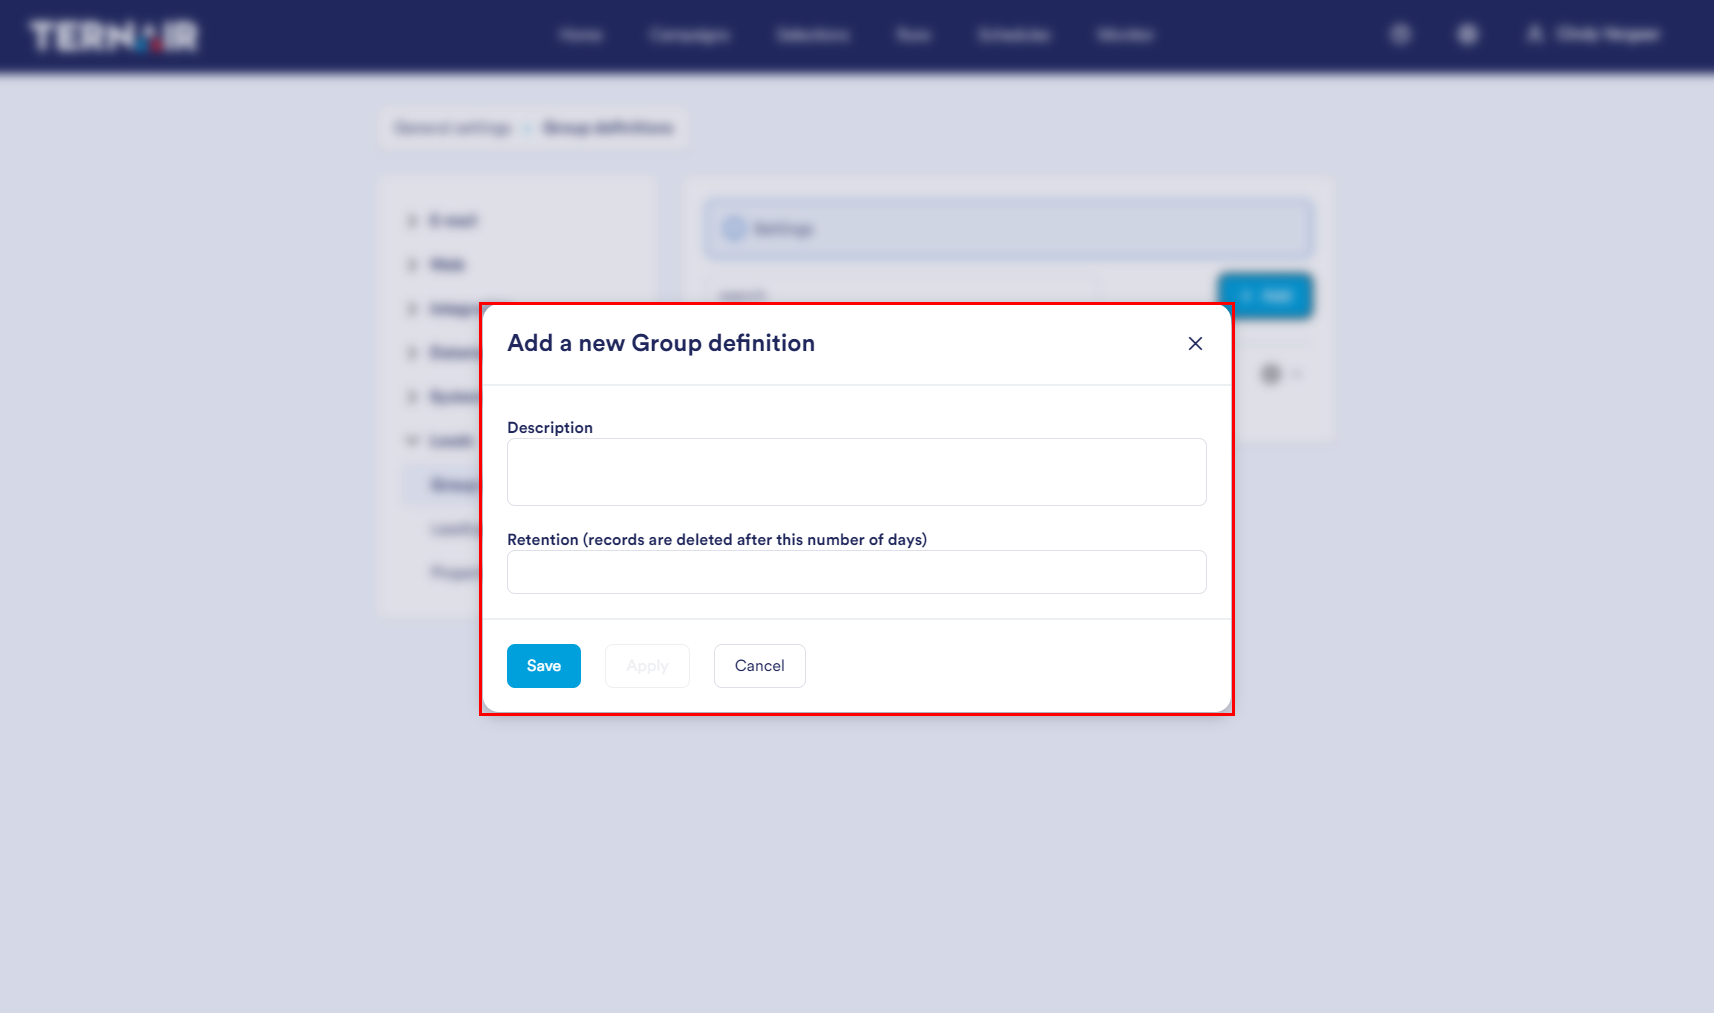
Give the group a clear description.
Under Retention, enter the retention period by entering the number of days after which the record is automatically deleted. For example: for a retention of 14 days, the record is automatically deleted after 14 days.
Leadtype definitions
Within a Group, you can create different Lead types.
Example:
- Group definition:
- Website downloads
- Lead type definition:
- Whitepaper Marketing automation
- Whitepaper Churn
- Webinar
The ‘Add’ button allows you to create a new lead type definition.
Lead type definitions that have been added before are visible on this tab. By clicking on the gear icon, you can edit, duplicate or delete an existing group definition.
The screen with an unfolded edit menu looks like this:
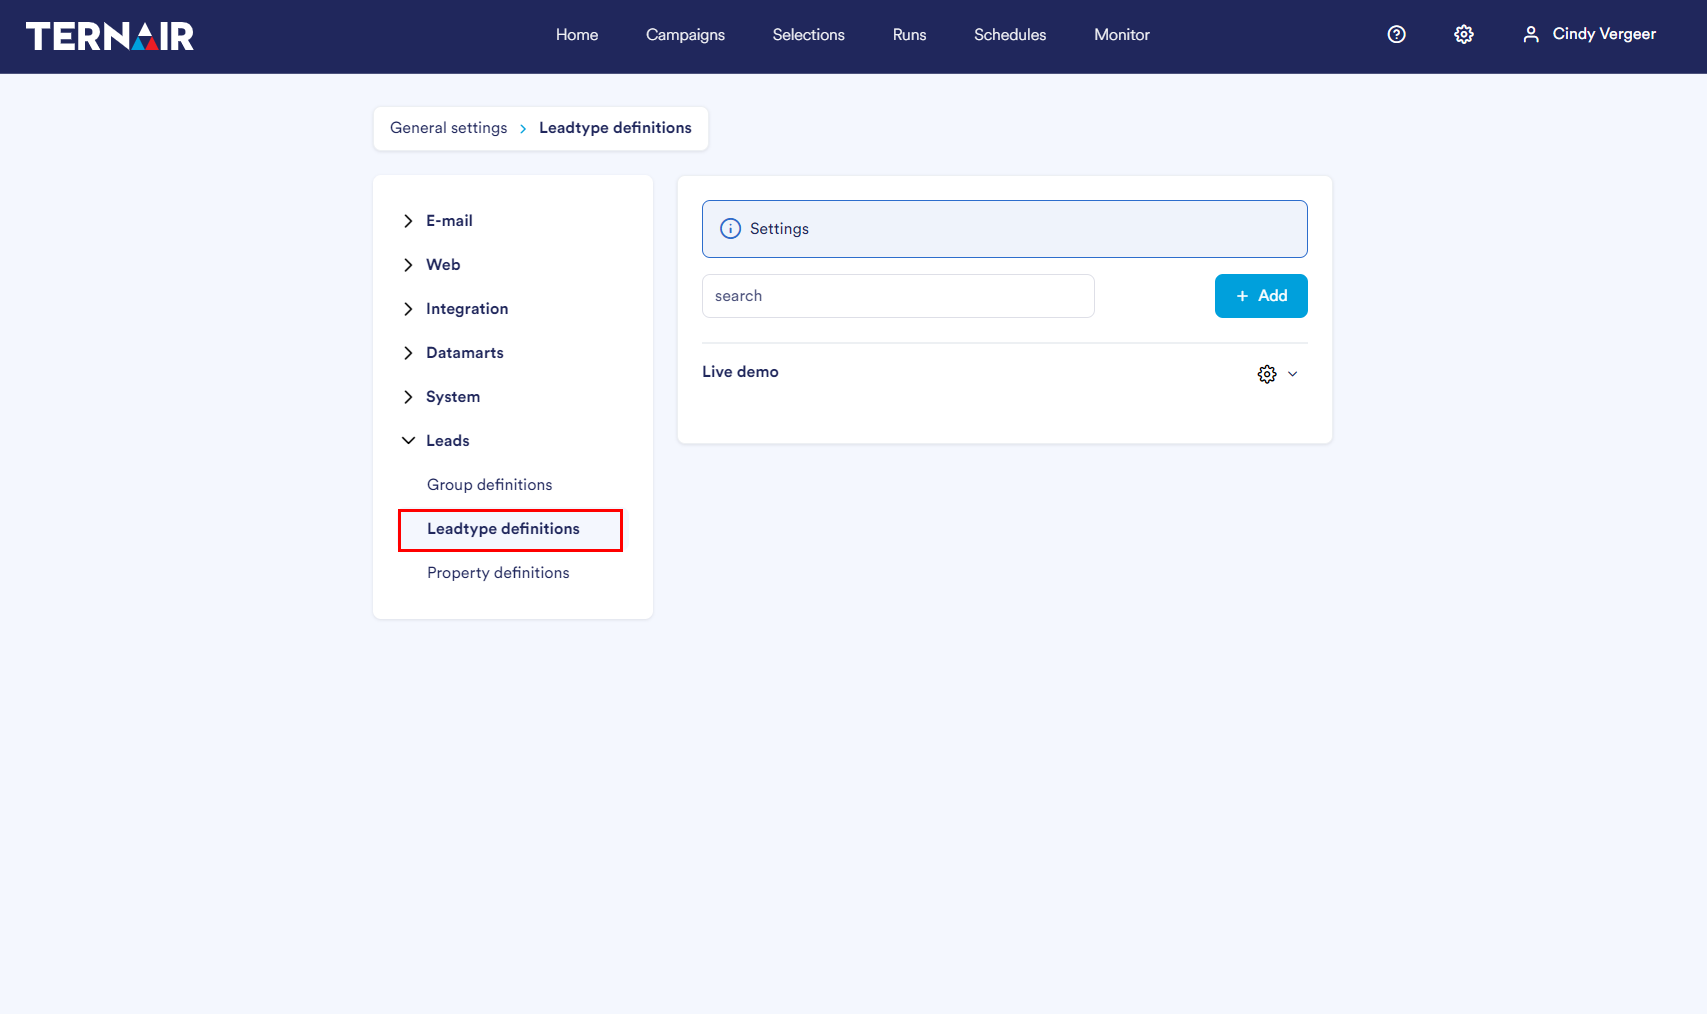
New Leadtype
Once you have clicked Add, you will see the screen below:
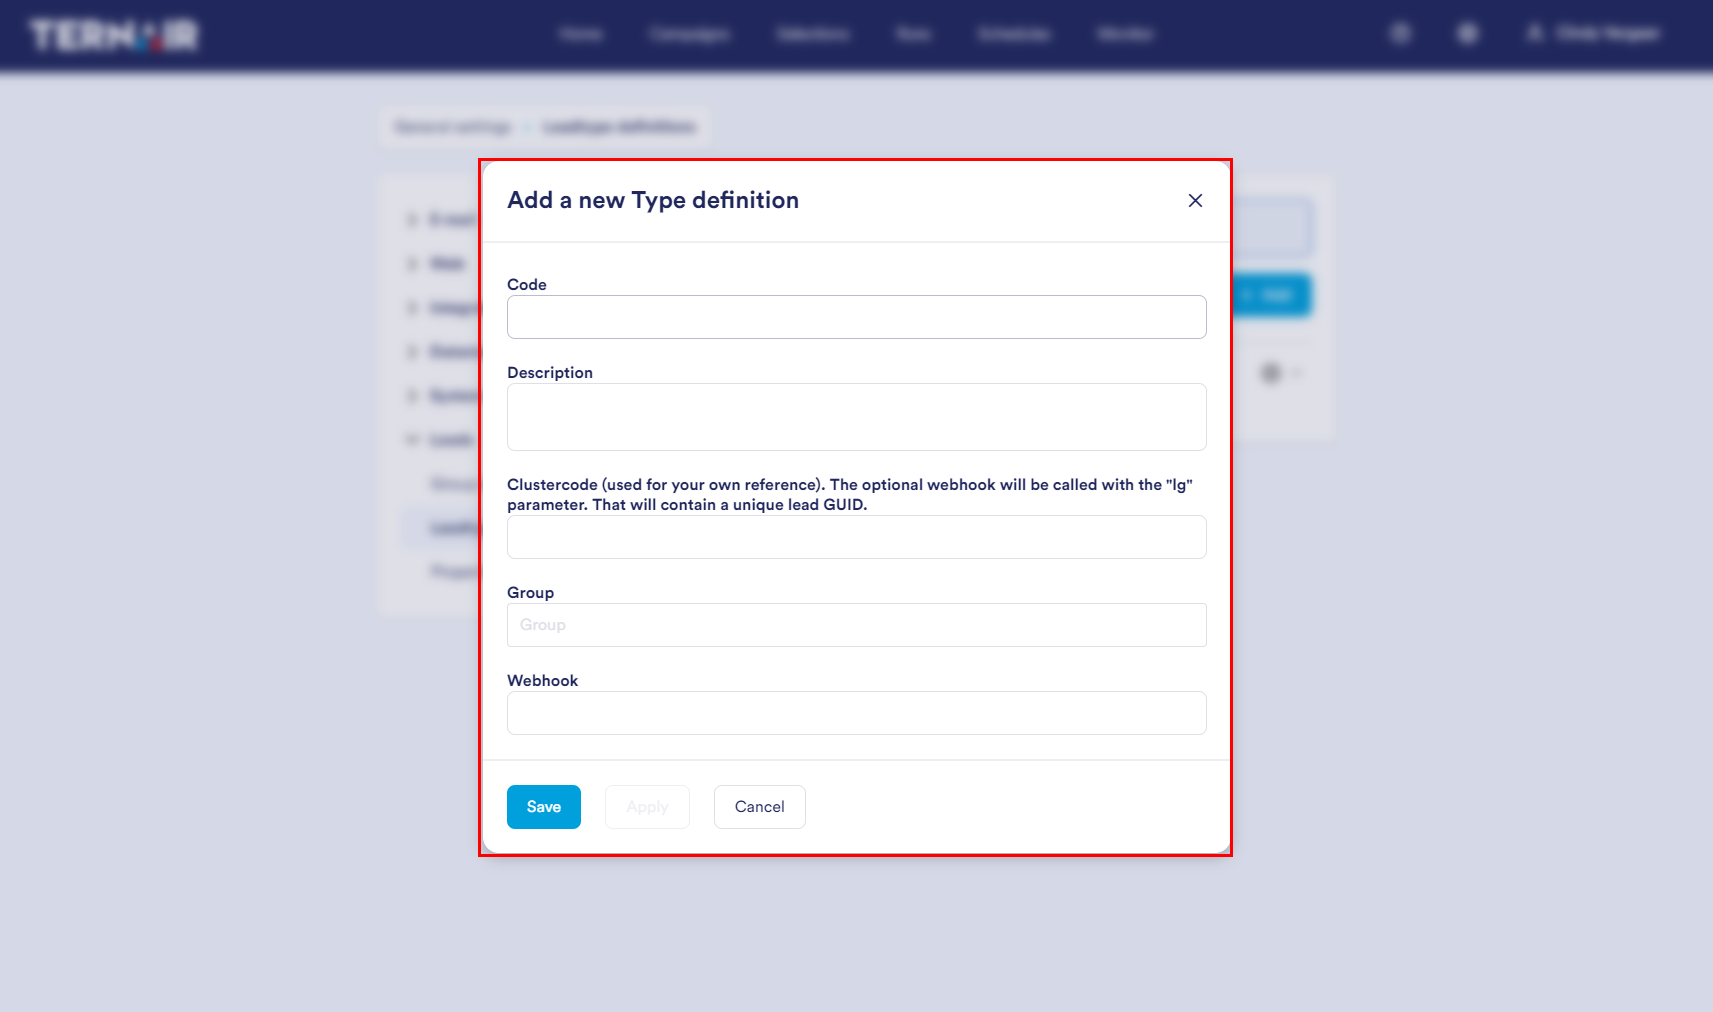
Enter a Code and Description for the leadtype. For example, Whitepaper Marketing Automation.
The Clustercode is for your own reference. For example Whitepaper
Under Group, select the group you created in the previous step. For example Whitepaper download.
At Webhook, enter the URL of the webhook. As soon as a lead arrives on this type, the webhook will go off automatically.
Property definitions
Under Property definitions, you can create additional fields that you want to save for your leads.
By default, you can include the following fields:
“Personal”: {
“Email”: “string”,
“Phonenumber”: “string”,
“Initials”: “string”,
“FirstName”: “string”,
“MiddleName”: “string”,
“LastName”: “string”,
“Gender”: “string”,
“Address”: {
“Street”: “string”,
“Housenumber”: “string”,
“HousenumberAddition”: “string”,
“Zipcode”: “string”,
“City”: “string”,
“Country”: “string”
}
},
“CompanyName”: “string”,
“Referrer”: “string
Example:
- Event
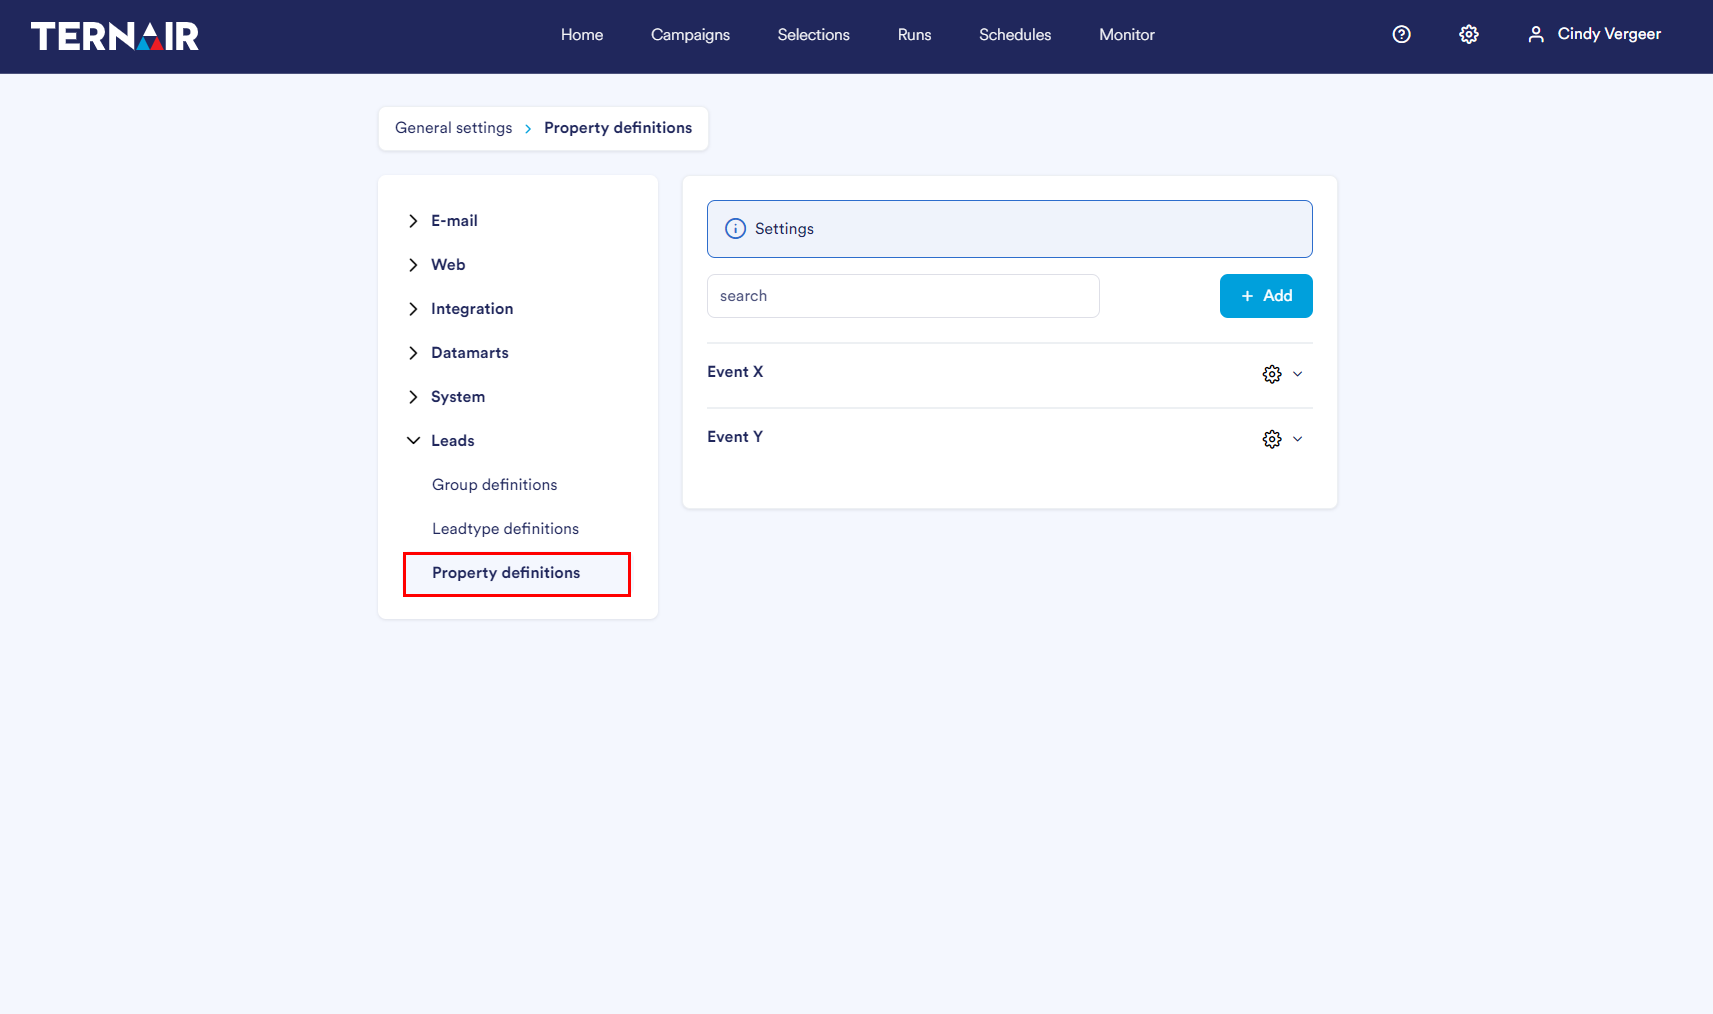
The ‘Add’ button allows you to create a new property definition.
Property definitions that have been added before are visible on this tab. By clicking on the gear icon, you can edit, duplicate or delete an existing group definition.
The screen with an unfolded edit menu looks like this:
New Property
Once you have clicked Add, you will see the screen below:
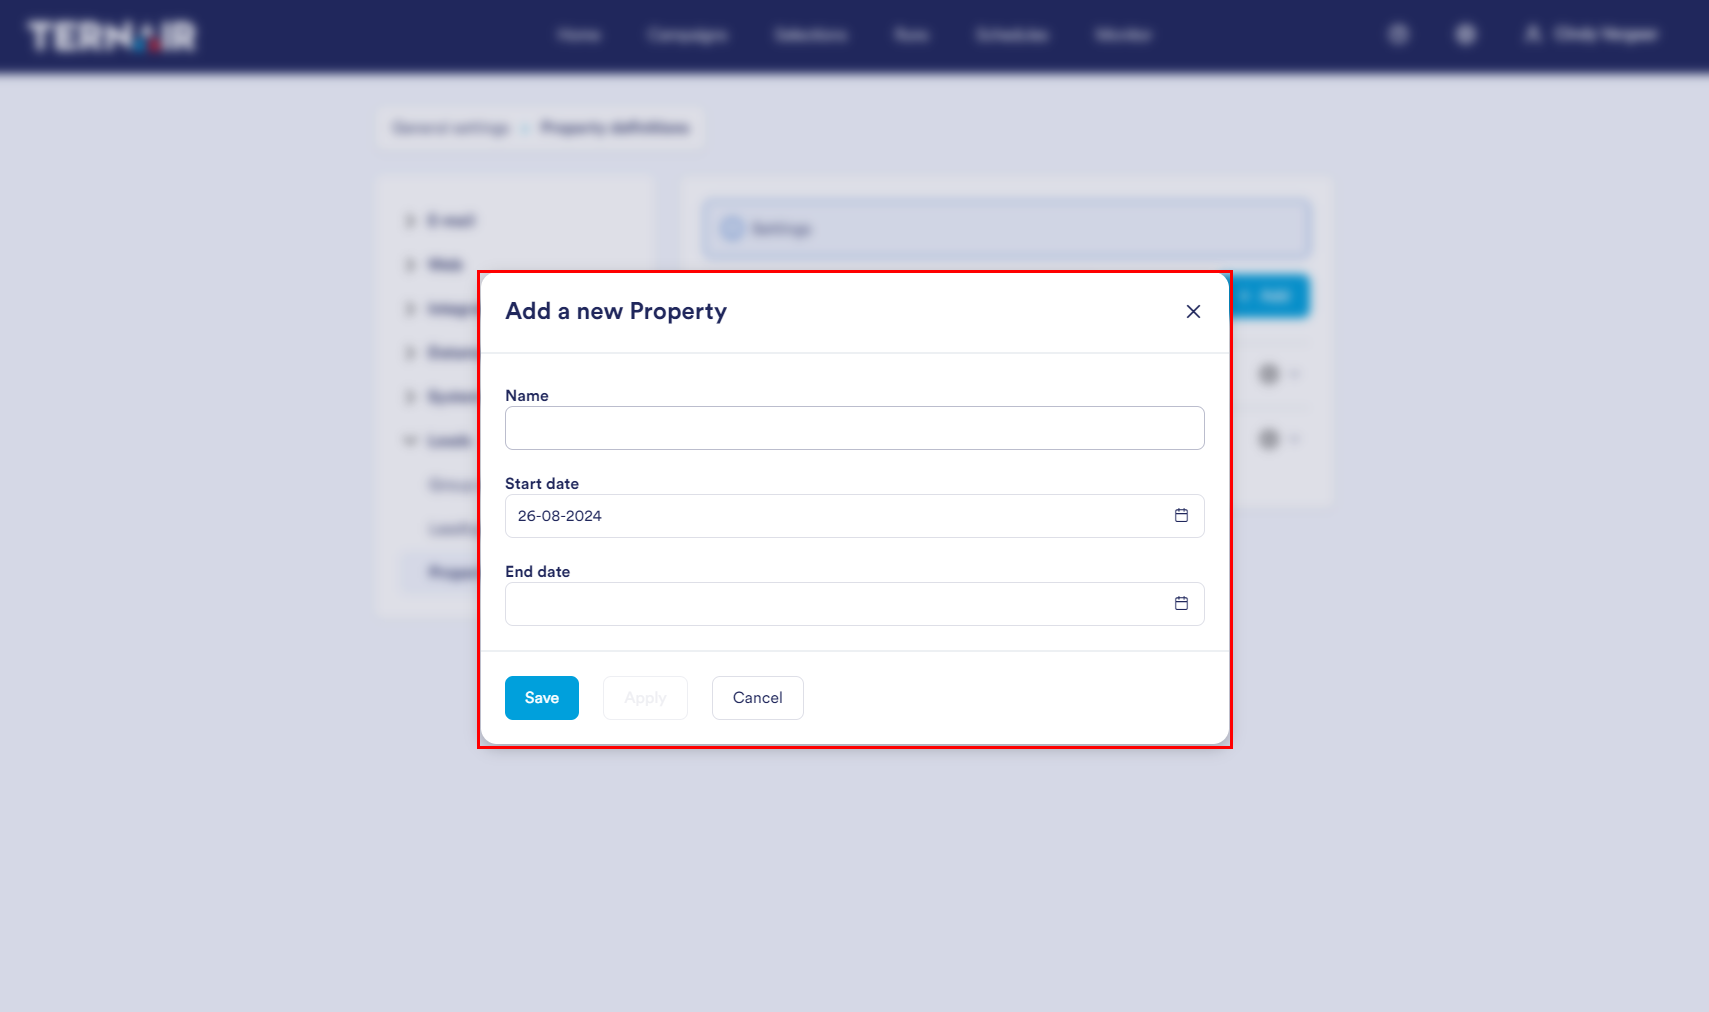
Give the property a Name.
Define the Start date when the form goes live and the data should be saved.
Optionally, you can also include an End date.
After creating the Property, you can offer it in the Interact API and select it under embedded forms.
